These days, low volume and volatility are creating a degree of fear in the market. As we enter into the infamous worst month for the stock market, and near the four-year anniversary of the collapse of Lehman Brothers, it's worth pointing out that just a few years ago these low vol conditions would've been welcomed with open arms. 300, 400, and 500 point swings on the Dow Jones Industrial Average were common, and sometimes the only warning that another financial institution was on the brink.
It started slowly with Countrywide, New Century Financial and Bear Stearns, but erupted with Fannie Mae, Freddie Mac, AIG, and Lehman Brothers. In September 2008, Wall Street was sinking and taking Main Street with it. Nobody knew what was going to unfold, how far the subprime mortgage contagion had spread, or when the subsequent global sell-off would abate.
The financial crisis changed us. It left our sentiment scarred, our nerves on edge, but also increased our awareness of the financial and economic climate. It turned financial news into front page news.
Last year Bespoke Investment Group began tracking the occasions when financial stories "cross over" to become mainstream news. Using one of the most widely visited general news/political websites, DrudgeReport.com as the barometer, Bespoke found a strong correlation between the number of financial stories that ran as the top headline and the condition of the stock market. Co-Founder Paul Hickey explains the Drudge Headline Indicator in the above video clip.
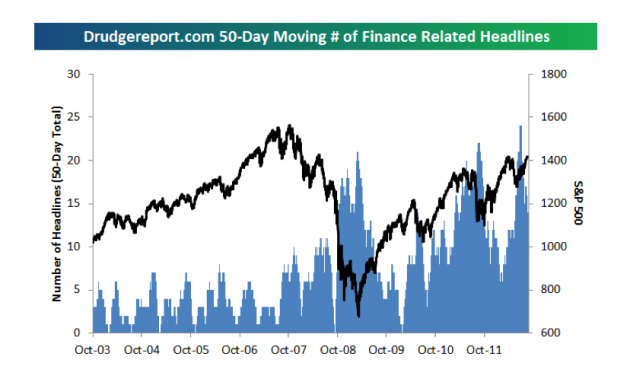
Bespoke monitors the Drudge Report everyday to calculate how many days the site runs a financial-related top headline on a 50-day rolling period. The chart below illustrates how it stacks up against the S&P 500.
 Source: B.I.G.
Hickey points out that the first significant peak, 21 days out of 50, was hit on February 27, 2009; just ten days before the S&P 500's bear market bottom on March 9. Last August during the debt ceiling debate and U.S. credit rating downgrade, the indicator broke to a new high ? 22 of 50 days. Following that peak, the market bottomed.
So where do we stand today? Bespoke's Drudge indicator hit an all-time high in June with 24 of 50 days running financial stories as leading headlines. This is when Europe re-emerged and the market hit summer lows. Since then the S&P has rallied 11%.
"What the takeaway is, is that once Drudge is talking about it [a financial story], and everyone is talking about it, then the market has digested it," says Hickey. So what we have is a classic contrary indicator. When Drudge financial headlines rise, the market is at or near bottom.
"Interestingly, the highs it's made each of the last couple of years has been even higher than what we saw during the financial crisis," he notes. "I think the reasoning behind that is the fact that once we had the financial crisis, finance became a much bigger part of everybody's world."
Take it for what it's worth, but never let a good indicator go unnoticed. The next time you see a string of financial news headlines topping the Drudge Report, it could just be your next great buying opportunity.
Let us know your thoughts on our Facebook page.
Source: http://finance.yahoo.com/blogs/breakout/drudge-report-tell-stock-market-132701338.html
shea weber greystone sidney crosby at the drive in alternative minimum tax modeselektor gran torino
No comments:
Post a Comment
Note: Only a member of this blog may post a comment.